The Rampant Start of 2024 for the S&P 500
This year has been a dream for bulls, with the S&P 500 setting a new all-time high 11 times in the first 33 trading days - one of the most frenzied starts in decades.
However, history shows that the S&P 500 has tended to struggle in the following weeks and months after such a torrid pace of new highs to begin a year. Only in 1964 did the index continue rallying after setting 10+ new highs in the first 33 sessions.
The other cases saw the index give back some gains or post outright negative returns in the next few months. Looking at the chart below, you can see in the blue box that returns over the next 1-2 months have been negative, posting gains 44% of the time over the next two months.
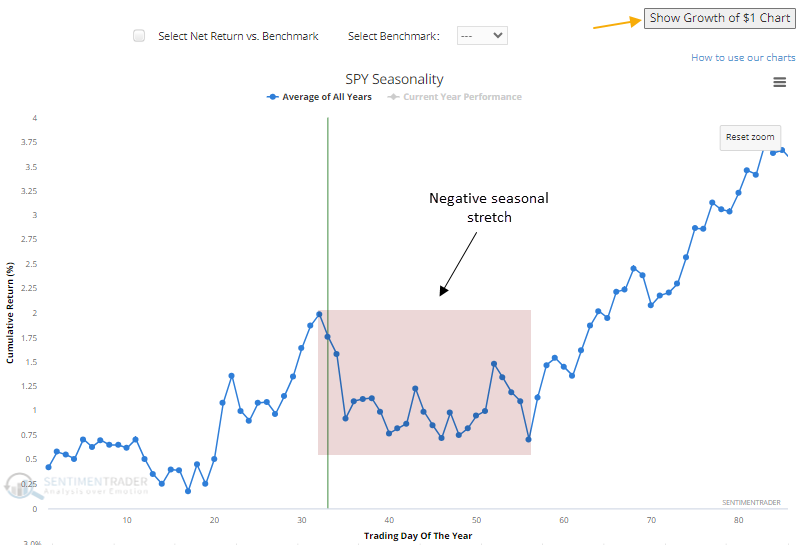
This short-term potential stalling could be due in part to seasonality. The chart below shows the average cumulative return for the S&P 500 over the past 30 years. The S&P 500 has tended to peak right around the 30th trading day of the year and decline over the next 30 or so days, before resuming higher.
While medium-term returns have been lackluster after years like 2024's lightning start, the good news for longer-term investors is that this “hot start” to a year has historically been good news, with gains six months later 100% of the time (green box top chart) and 12 months later 89% of the time. This seasonal weakness has traditionally been more of a “profit-taking” moment and an opportunity to “buy the dip.”
So, while the red-hot pace could cool in the near term based on seasonal patterns, in the longer term, the stellar start to 2024 bodes well for a continuation of the early momentum and robust S&P 500 performance; if history is any guide.


