Another Bullish Signal for the S&P 500
As investors, we’re always looking for signs that can give us an edge in determining the market's next move.
Technical indicators that capture investor sentiment and momentum can provide useful signals about future trends. In his latest piece, Jay Kaeppel (owner of Sentiment Trader, a research firm we work with), highlights one such indicator - the Relative Strength Index (RSI) and how it recently flashed a bullish sign for the S&P 500.
Kaeppel focuses on the 14-week RSI for the S&P 500. RSI stands for Relative Strength Index, which, if you want all the details, can be found HERE, but in general, it’s a momentum indicator ranging from 0-100.
The higher the number, the more positive momentum and the higher the likelihood of a positive market, and vice versa with a lower number.
When this indicator crosses above 60 after dropping below 43, it tends to precede favorable price action over the next 6-9 months.
Jay tests a simple trading strategy around these RSI signals. The rules are to buy the S&P 500 after a sub-43 to over-60 reversal and hold for 189 trading days (roughly 9 months). If another signal occurs within 189 days, reset the timer for an additional 189 days.
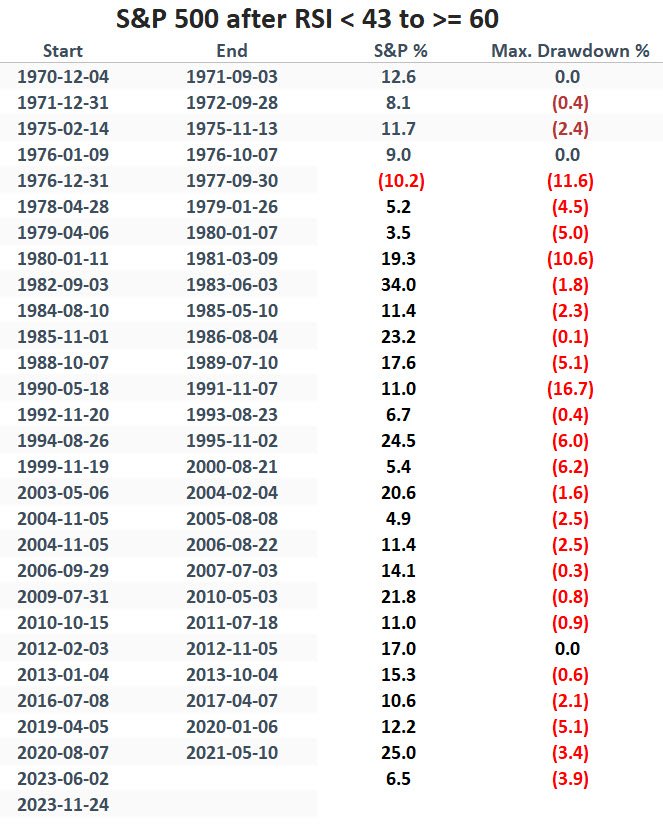
Here is a look at all the instances of this occurring dating back to 1970:
The results are impressive.
Of the 27 complete instances above, 26 had a positive return after 189 days, with an average S&P 500 gain of 13.2%. Maybe more importantly, only 3 of the 27 instances experienced a drawdown during the 189-day period of greater than 10%. In other words, not only did the signals precede strong returns more often than not, but most of the time, any declines were relatively muted before the uptrend resumed.
So what does this mean for us today? Well, we got another positive signal on November 24th as you can see in the chart below. Weekly RSI crossed below 43 (red line) and then moved up over 60 (green line), setting a new 189-day timer with a projected holding period until August 2024.
Of course, past performance does not guarantee future results, and technical indicators on their own should not drive investment decisions. But Kaeppel's work does provide an insightful way to capture shifting investor psychology.
And with both momentum and sentiment seemingly aligned to the positive side, it gives us yet another reason to believe this market may have room to run over the next 6-12 months.
Talk soon!
Shean


